How Much is Gasoline in Europe Today?
Compare gasoline prices across the European Union with this table, sorted by price and converted to US dollars per gallon for easy comparison with American fuel costs.
📅 Last updated: June 04, 2026 · Data from: June 01, 2026 · Source: European Commission Oil Bulletin. Updated every Thursday.
| Country | €/Liter | €/Gallon | $/Gallon |
|---|---|---|---|
| Denmark | €2.39 | €9.05 | $10.51 |
| Netherlands | €2.30 | €8.71 | $10.11 |
| Finland | €2.20 | €8.33 | $9.67 |
| France | €2.06 | €7.80 | $9.06 |
| Greece | €2.06 | €7.80 | $9.06 |
| Germany | €1.96 | €7.42 | $8.62 |
| Italy | €1.95 | €7.38 | $8.57 |
| Portugal | €1.94 | €7.34 | $8.53 |
| Latvia | €1.88 | €7.12 | $8.27 |
| Belgium | €1.85 | €7.00 | $8.13 |
| Ireland | €1.84 | €6.97 | $8.09 |
| Romania | €1.84 | €6.97 | $8.09 |
| Estonia | €1.81 | €6.85 | $7.96 |
| Lithuania | €1.79 | €6.78 | $7.87 |
| Austria | €1.74 | €6.59 | $7.65 |
| Slovakia | €1.74 | €6.59 | $7.65 |
| Czechia | €1.72 | €6.51 | $7.56 |
| Slovenia | €1.72 | €6.51 | $7.56 |
| Croatia | €1.70 | €6.44 | $7.47 |
| Luxembourg | €1.70 | €6.44 | $7.47 |
| Hungary | €1.69 | €6.40 | $7.43 |
| Cyprus | €1.61 | €6.09 | $7.08 |
| Sweden | €1.61 | €6.09 | $7.08 |
| Spain | €1.55 | €5.87 | $6.81 |
| Bulgaria | €1.53 | €5.79 | $6.73 |
| Poland | €1.42 | €5.38 | $6.24 |
| Malta | €1.34 | €5.07 | $5.89 |
Liter prices from the European Commission Oil Bulletin (EUR). Gallon = 3.785 L. USD column applies today’s ECB EUR→USD reference rate of 1.1614.
Euro-Super 95 (Gasoline/Fuel) prices in the 27 EU Countries. Source: European Commission.
Fuel Prices in Europe Maps
Static Map: Gasoline Prices in the EU

Europe’s pump prices in June 2026 trace a familiar northwest-to-southeast gradient, but the slope has steepened. Denmark (€2.39/L, $10.51/gal) and the Netherlands (€2.30/L, $10.11/gal) again top the table, with Finland not far behind at €2.20/L ($9.67/gal). At the opposite extreme sit Malta (€1.34/L, $5.89/gal) and Poland (€1.42/L, $6.24/gal), where lower duties and weaker demand have absorbed less of the post-Hormuz crude shock. France and Greece, both at €2.06/L ($9.06/gal), illustrate how Mediterranean and Atlantic Europe have converged near the bloc’s upper band.
- Nordic-Benelux premium: Denmark, the Netherlands and Finland account for the only three prices above €2.20/L.
- Eastern discount: Poland, Bulgaria and Hungary remain a euro below the Nordic peak, reflecting lower fiscal loadings.
- Crisis spread: The €1.05/L gap between Malta and Denmark is the widest in nearly two years, a direct consequence of the spring crude spike.
Interactive Map: Gasoline Prices in the EU
Click on any EU country on the map below to view gasoline prices per liter (EUR) and per gallon (USD):
The EU’s 27 member states span a remarkable range at the pump. Malta, the cheapest market, sells gasoline for €1.34/L ($5.89/gal); Denmark, the priciest, charges €2.39/L ($10.51/gal) — nearly 80% more. The simple bloc average sits at €1.81/L ($7.97/gal), a level pushed sharply higher by the March 2026 disruption to Strait of Hormuz crude flows. The five-tier breakdown below shows how thinly populated the lowest band has become.
Above $9.00/gal — The Northern peak
- Denmark — €2.39/L ($10.51/gal)
- Netherlands — €2.30/L ($10.11/gal)
- Finland — €2.20/L ($9.67/gal)
- France — €2.06/L ($9.06/gal)
- Greece — €2.06/L ($9.06/gal)
$8.00–$8.99/gal — The core economies
- Germany — €1.96/L ($8.62/gal)
- Italy — €1.95/L ($8.57/gal)
- Portugal — €1.94/L ($8.53/gal)
- Latvia — €1.88/L ($8.27/gal)
- Belgium — €1.85/L ($8.13/gal)
- Ireland — €1.84/L ($8.09/gal)
- Romania — €1.84/L ($8.09/gal)
$7.00–$7.99/gal — The middle band
- Estonia — €1.81/L ($7.96/gal)
- Lithuania — €1.79/L ($7.87/gal)
- Austria — €1.74/L ($7.65/gal)
- Slovakia — €1.74/L ($7.65/gal)
- Czechia — €1.72/L ($7.56/gal)
- Slovenia — €1.72/L ($7.56/gal)
- Croatia — €1.70/L ($7.47/gal)
- Luxembourg — €1.70/L ($7.47/gal)
- Hungary — €1.69/L ($7.43/gal)
- Cyprus — €1.61/L ($7.08/gal)
- Sweden — €1.61/L ($7.08/gal)
$6.00–$6.99/gal — The Iberian-Eastern discount
- Spain — €1.55/L ($6.81/gal)
- Bulgaria — €1.53/L ($6.73/gal)
- Poland — €1.42/L ($6.24/gal)
Below $6.00/gal — The outlier
- Malta — €1.34/L ($5.89/gal)
The full EU range runs from $5.89/gal in Malta to $10.51/gal in Denmark — a spread of $4.62/gal, or roughly 78% of the cheaper price. Excise duties and VAT account for a large share of that gap, with the supply shock of the past three months magnifying differences that fiscal policy used to mask.
EU-Average Gasoline Price Trends

The 52-week trajectory tells a story of two halves. Gasoline bottomed at €1.59/L in late December 2025 and drifted upward through January and February before the March 2026 Iran-Hormuz disruption sent Brent crude through $100 per barrel. By late May the EU weighted average had touched €1.90/L — a 12-week gain of 4.28% and a year-on-year increase of 14.82%. The most recent print of €1.848/L marks a tentative 2.74% pullback week-on-week, as OPEC+ output additions in April and May (a combined 394,000 barrels per day) and temporary national tax measures in France, Hungary, Spain and Poland began to bite. A stronger euro, which has appreciated roughly 5% against the dollar since March, has trimmed the import bill modestly but cannot offset the crude-side pressure. Refinery outages — including the 400,000 bpd Rotterdam shutdown — continue to keep distillate margins elevated heading into the summer driving season.
- Range: €1.590/L (2025-12-22) to €1.900/L (2026-05-25), a 19.5% peak-to-trough swing.
- Momentum: +4.28% over 12 weeks, +14.82% year-on-year, but -2.74% in the past week as OPEC+ supply trickles in.
- Volatility: Elevated since March; the post-Hormuz shock added an estimated €0.30–0.45/L before partial fiscal offsets.
Source: European Commission Oil Bulletin (Weekly Oil Price Update).
Historical Maps: 2017 and 2021
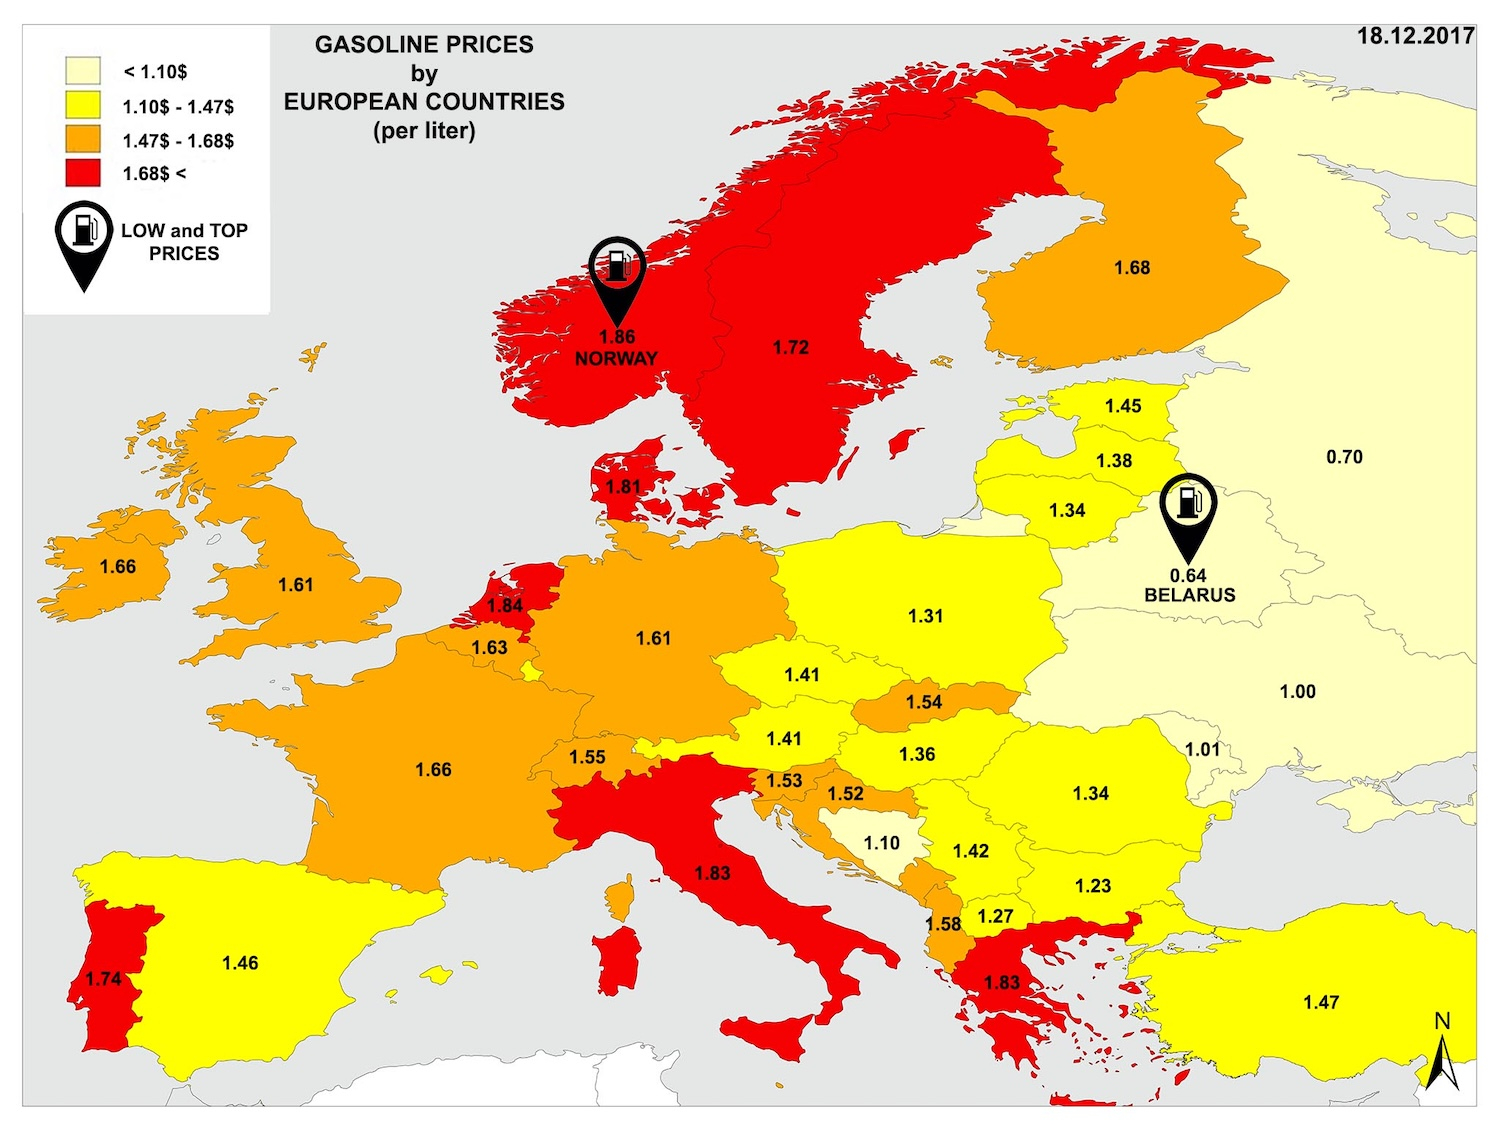
December 2017 — the pre-pandemic baseline
The 2017 map captured a Europe where the simple average gasoline price sat around $1.42 per liter ($5.38 per gallon) — less than half of where the EU-27 average stands today. The dispersion across the continent was already wide. Norway ($1.86/L) and Italy ($1.84/L) topped the table, both driven by some of the highest excise + VAT loadings in Europe. The Netherlands, Sweden and Greece filled out the rest of the expensive cluster, all over $1.65 per liter.
At the cheap end, Belarus ($0.64/L), Russia ($0.70/L) and Kazakhstan ($0.63/L) sold gasoline at a third of Norwegian prices — subsidised, oil-producing, and outside the EU’s tax-and-tariff architecture. Inside the EU, the eastern flank (Poland, Romania, Bulgaria) sat between $1.10 and $1.25, reflecting lower excise duties and lighter VAT regimes than their western neighbours.
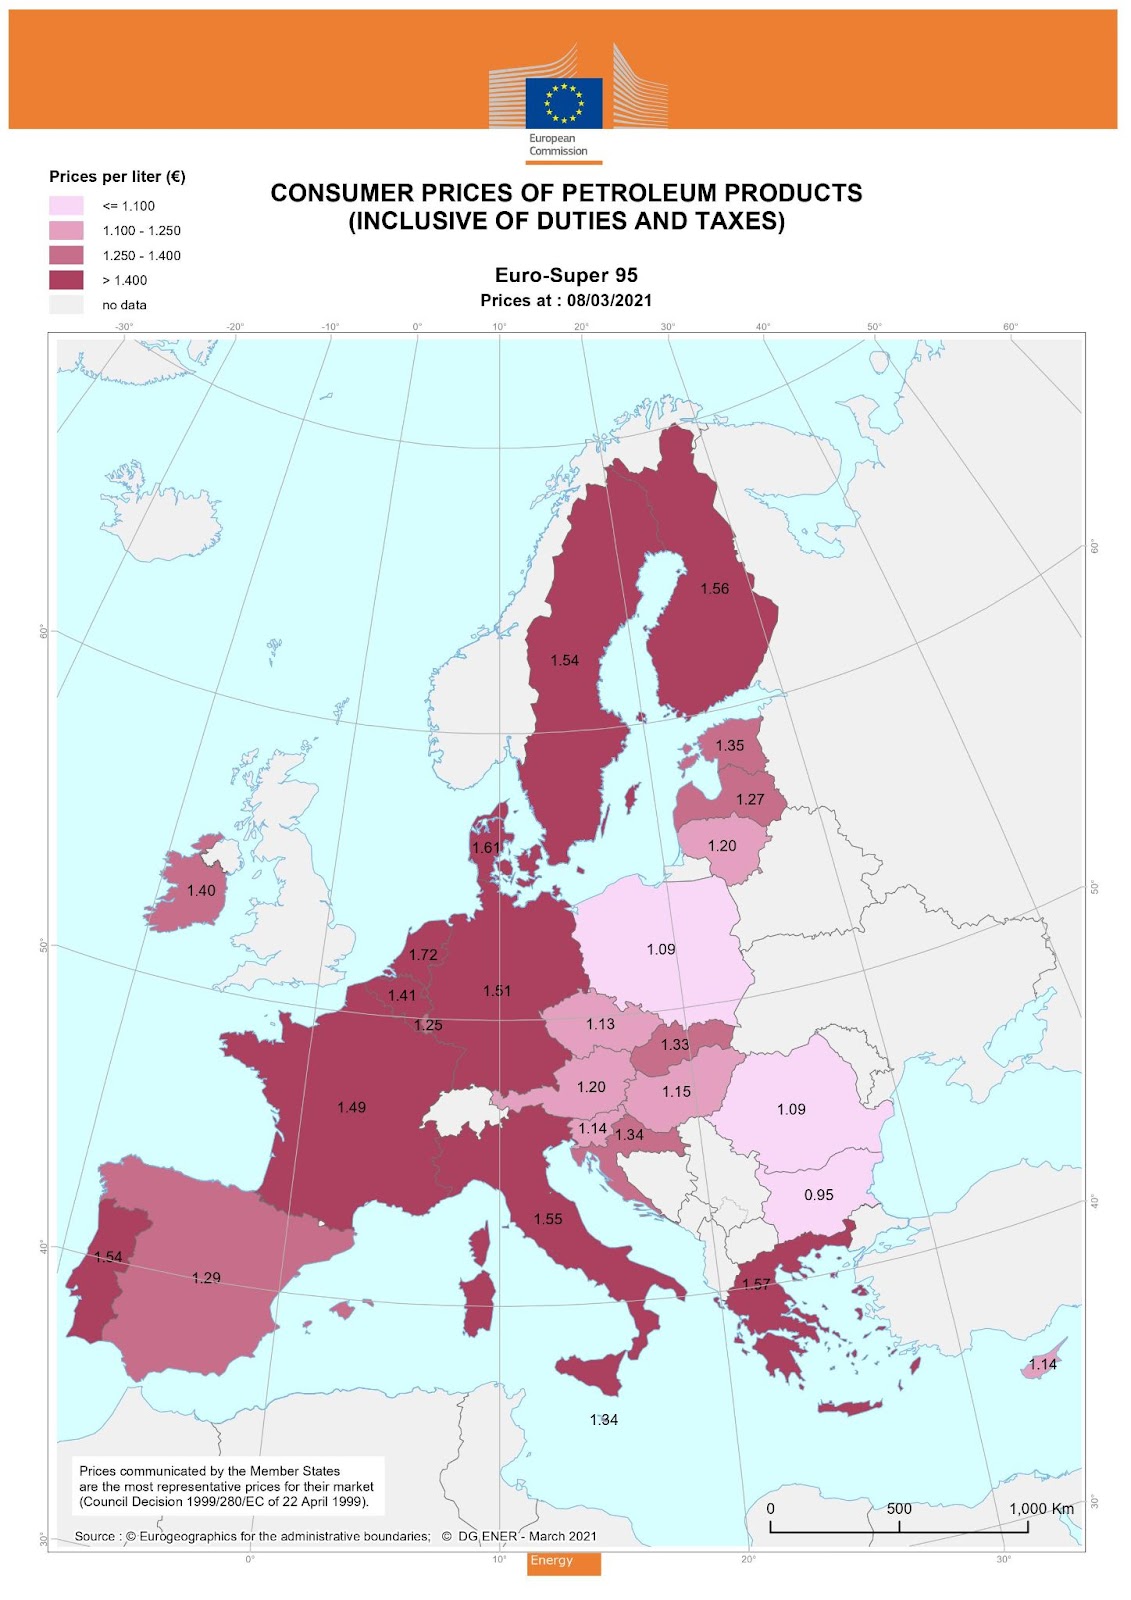
March 2021 — after the pandemic shock
Three years later the picture shifted but the geography stayed familiar. The EU average climbed to €1.36 per liter as economies reopened and Brent crude recovered from its April 2020 trough. The Netherlands (€1.72) and Greece (€1.57) led the expensive end, with Italy, Finland and Sweden close behind. The eastern budget tier held: Bulgaria (€0.95), Poland (€1.09) and Romania (€1.11) remained the cheapest forecourts in the bloc.
By 2021 a structural pattern had become unmistakable. The north-western EU — high excise, high VAT, high household income — ran ~50% above the eastern flank. The Mediterranean middle (Spain, Portugal, Italy) sat above the eastern band but below the north, balancing higher tourist-season demand against lower disposable income.
2017 to today — what changed
Three structural forces explain the rise from the 2017 baseline:
- Excise + VAT increases. Several EU members tightened fuel taxation in the late 2010s to fund green-transition budgets. The Netherlands raised excise on petrol by ~€0.10/L between 2018 and 2024; Germany’s CO2 levy on transport fuels began in 2021 and ratcheted annually.
- The Russian-supply shock. Sanctions following the February 2022 invasion of Ukraine removed Russian crude and refined-product imports from western European refining baselines, forcing a re-routing through Middle Eastern and US Gulf Coast suppliers at higher delivered cost.
- EUR weakness against the dollar. Oil is priced in USD; a weaker euro means more euros per barrel even when the dollar price stays flat. The EUR/USD rate has spent most of 2022–2026 in a range that adds 8–15 % to euro-denominated pump prices versus the 2017–2019 baseline.
The eastern–western spread has actually widened since 2017. Where Norway used to be roughly 3× the price of Belarus, the modern Netherlands-to-Malta spread runs about $4.50/gallon — a wider absolute gap, narrower in percentage terms, but more visible to an American comparing US prices to Europe.


